I did some simple plotting of measurements taken by a single microphone. I clapped several times a few feet away from it. The first two claps were quite loud:
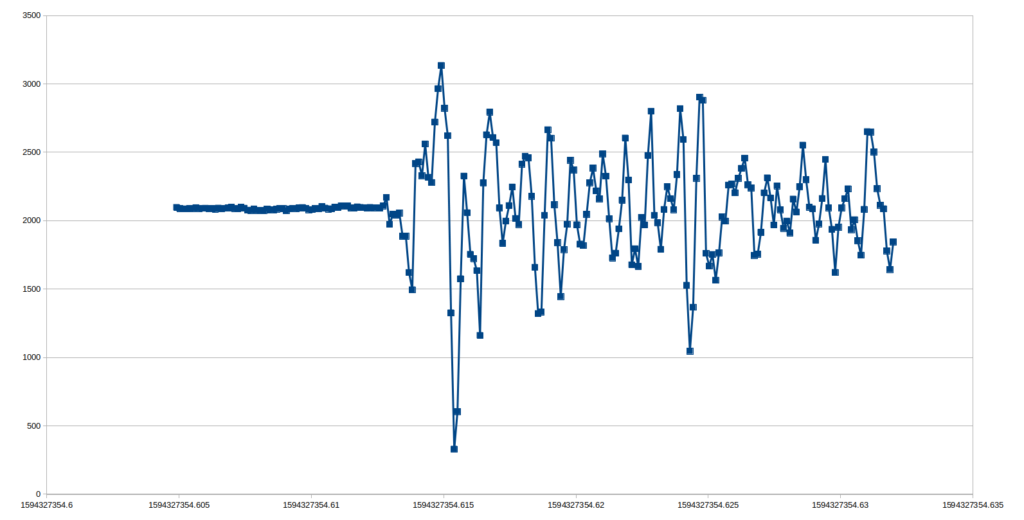
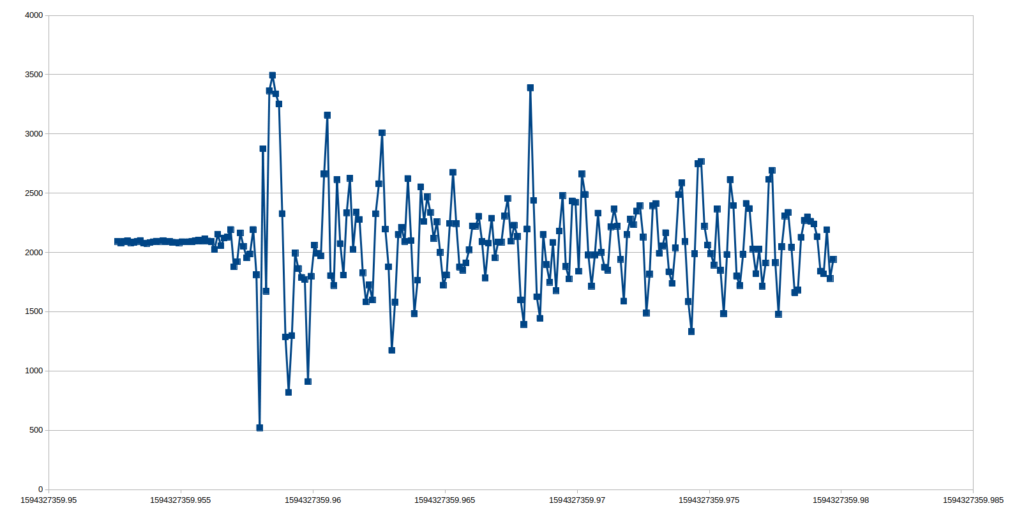
Full scale on the ADC is 12 bits, or 0-4095 units. Each unit represents about 3.3V/4095 = 0.8 millivolts. You can see that when idle it hovers around 2090, which is approximately half scale, so that’s good. A very loud sound sends it almost full scale (+/- 1500 units), which is also good. The RMS variation when quiet is around 10-20 units, which indicates there’s not a lot of noise in the system.
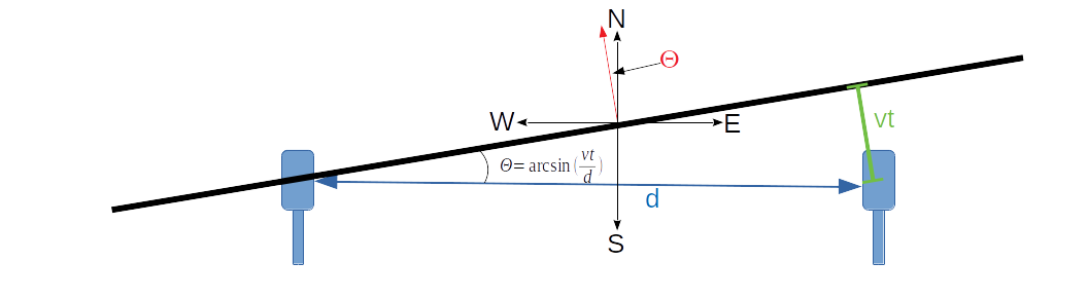
I’m trying to decide how to identify the time of the arrival of the wavefront. I could pick the reading that is furthest from the mean value and key off of the time of that, and I think this is what I’ll try first. I’m figuring that this translates into the peak of the initial attack, and that will be close to the same position in all the microphones.
The other strategy is to just pick the first reading that is more than handful of standard deviations away from the mean, but that requires a more sophisticated analysis of the data leading up to the wavefront, and in the case where the wavefront is at the beginning of the packet of data, I may not have enough data in those few points to get a meaningful statistical picture, which means I need to get long-term averages from the microphone controllers themselves, which means more computation on the microcontrollers.
Quieter sounds (soft clapping) produced simpler and easier to interpret waveforms:
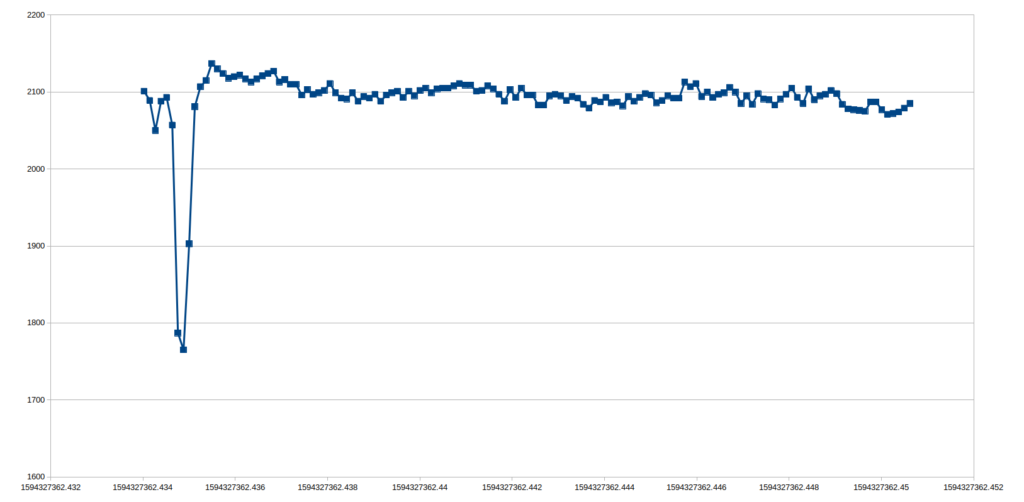
Here you can see that there is only really one big spike with a 300 unit deviation, and so keying off of that single value is likely the right strategy.
I’m going to have to wait till I have 2 microphones to see if I can synchronize their detection.